Scalable System Architecture with Docker, Docker Flow, and Elastic Stack: Logging Stack
Here we create our logging stack using Elasticsearch, Logstash, and Kibana.


Scalable System Architecture
In the previous post, we added frontend services to our cluster. These services are what face the internet and will act as the gate keepers to our internal network. Now we will be creating the logging stack.
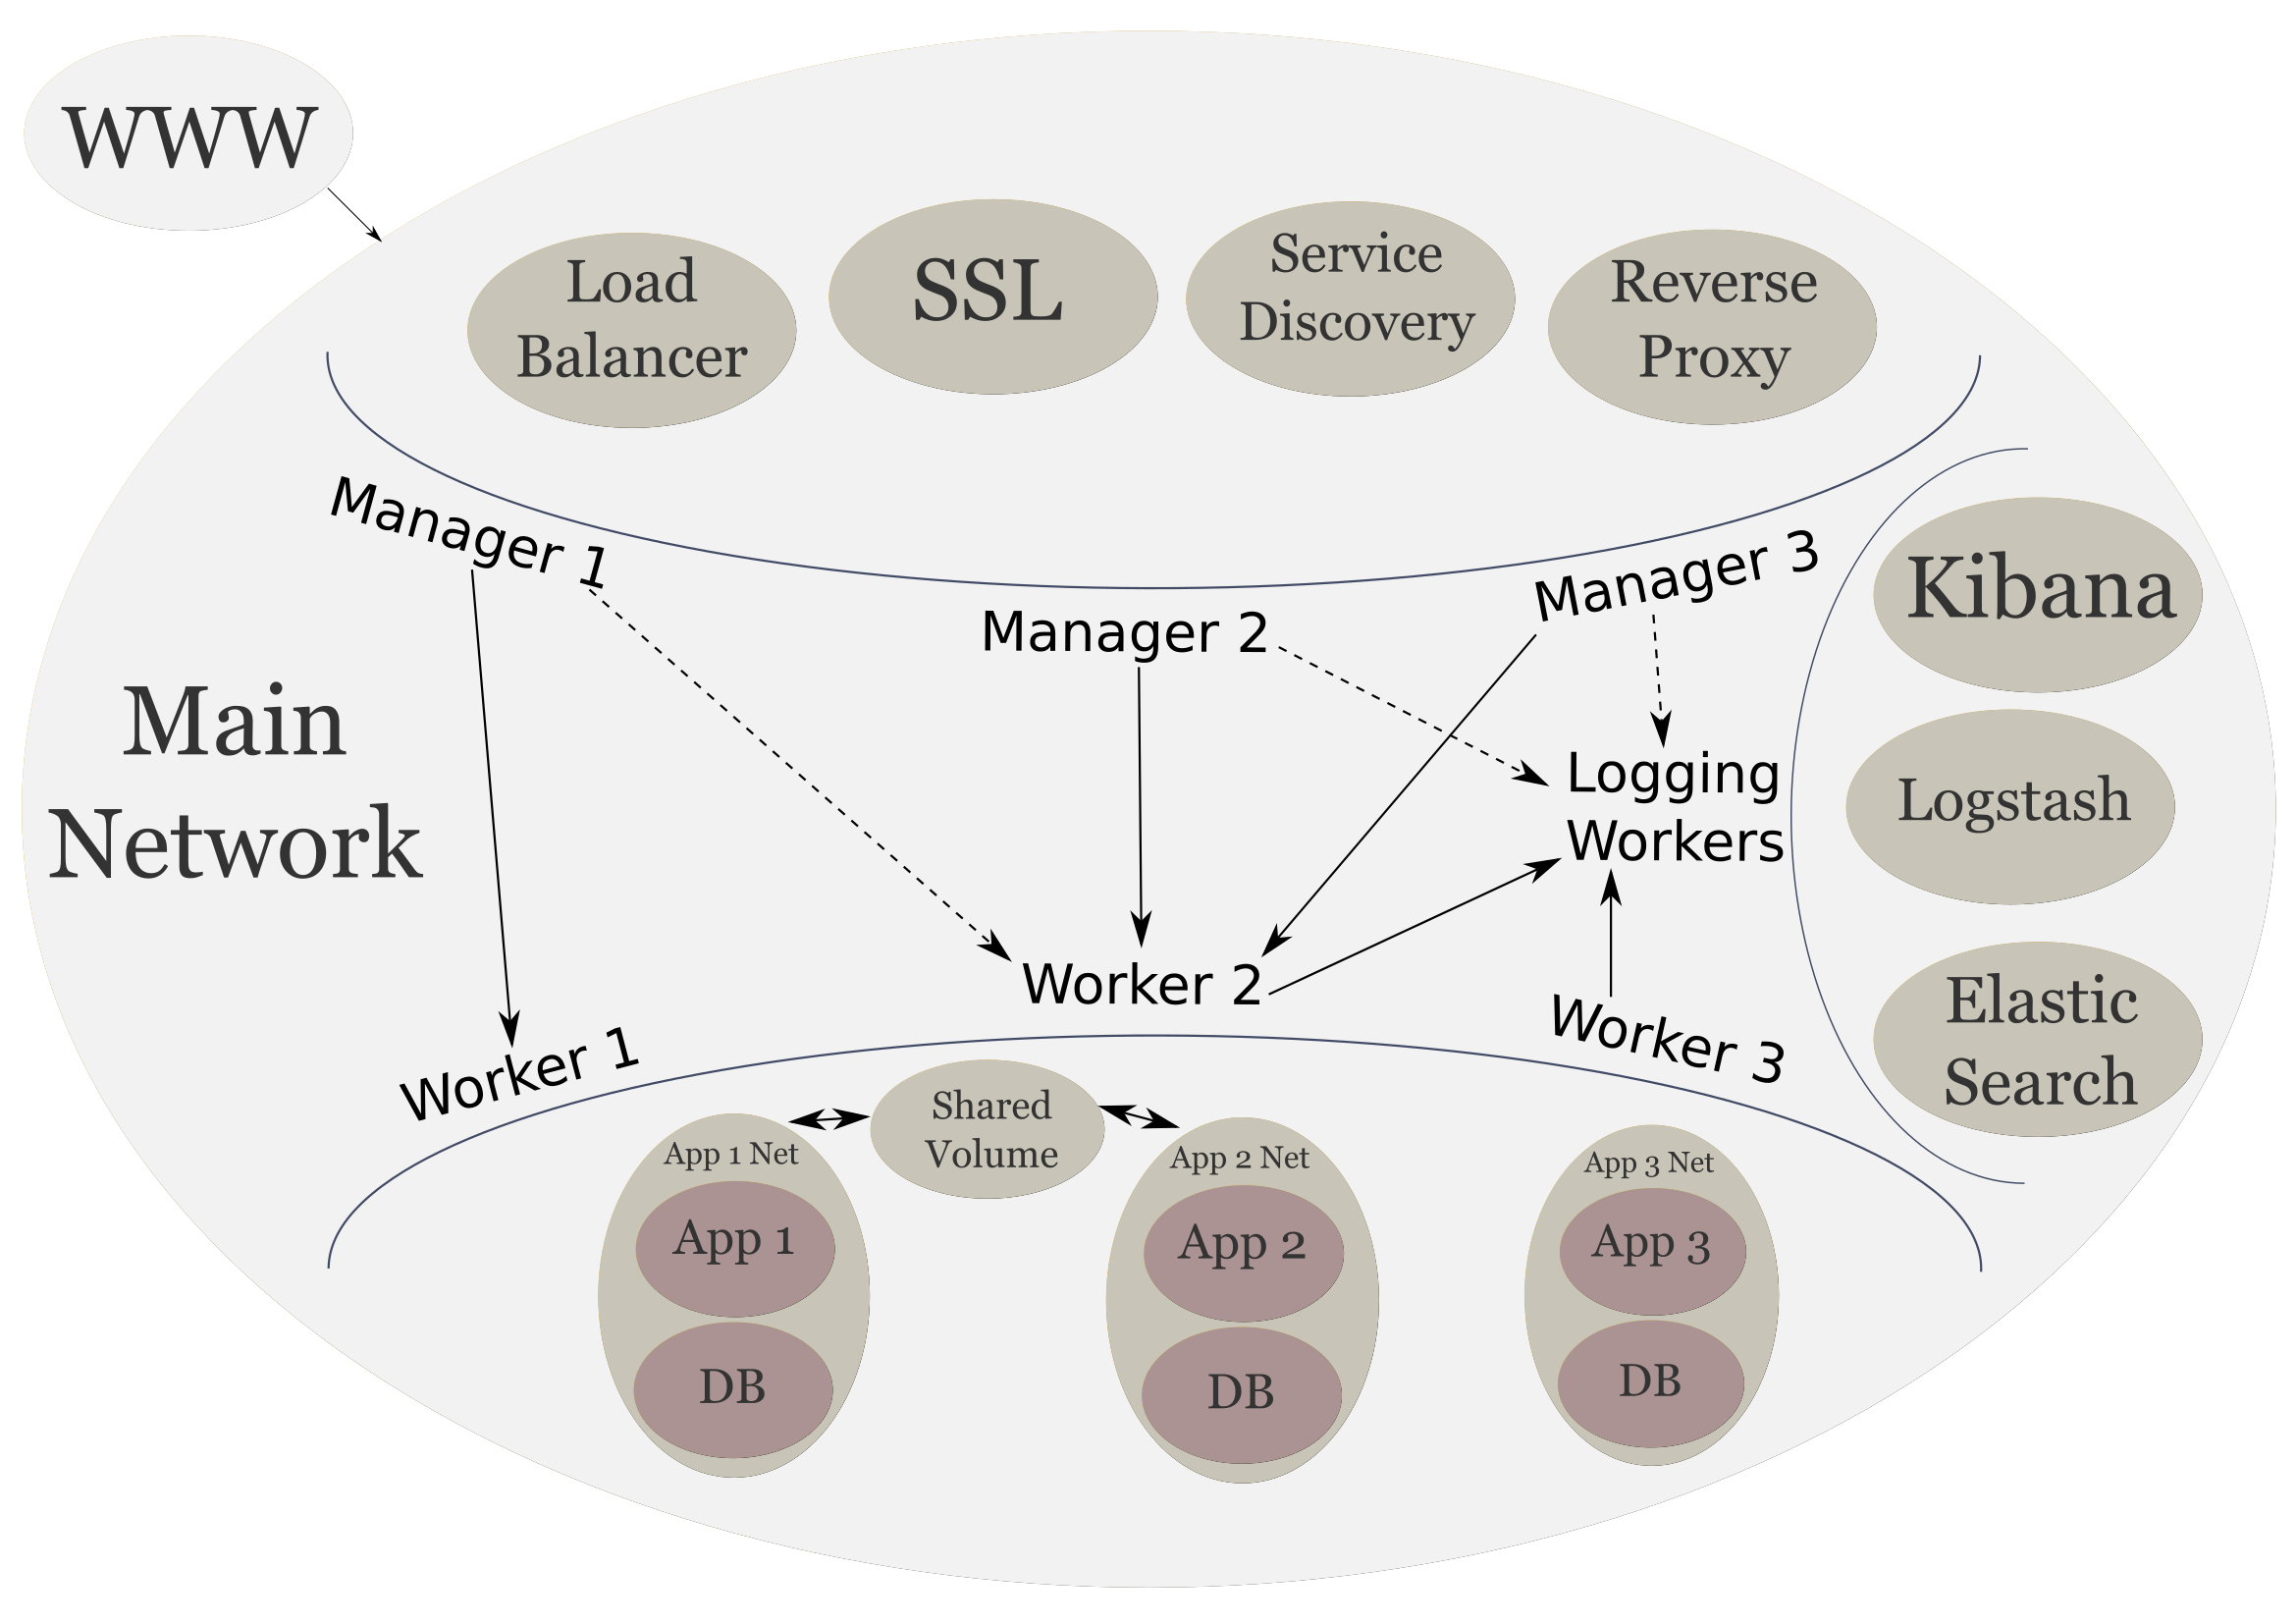
As a reminder, here is our high level diagram of the target infrastructure.
- Parts
- Technologies
- Elasticsearch
- Logstash
- Kibana
- Logging Services
- Elasticsearch Service
- Logstash Service
- Kibana Service
- Up Next
Parts
- Scalable System Architecture with Docker, Docker Flow, and Elastic Stack: System Provisioning
- Scalable System Architecture with Docker, Docker Flow, and Elastic Stack: Frontend Services
- Scalable System Architecture with Docker, Docker Flow, and Elastic Stack: Logging Stack (current)
- Scalable System Architecture with Docker, Docker Flow, and Elastic Stack: Backend Services
- Scalable System Architecture with Docker, Docker Flow, and Elastic Stack: Limitations and Final Thoughts
Technologies
As before we can install docker for our platform of choice. We will be using docker utility to create our services.
We will use the ELK (Elasticsearch, Logstash, Kibana) stack for our logging services. These will provide our logging, querying and visualizations for our cluster logs.
Elasticsearch
Elasticsearch will be the hub for our logging data. It provides a scalable search and analytics engine that will also store our data. It is one of the best options out there for storing and searching unstructured data. It is open-source, fast, and scalable.
Logstash
Logstash provides us with a pipeline that will allow us manipulate our data as it comes in. It can take data as input from many sources, filter, enhance and augment the data, and then output that data to many destinations. Our destination will be Elasticsearch. The details of the input, filtering, and output will be discussed a little futther down.
Kibana
Kibana will be our frontend for the data stored by Elasticsearch. Kibana can visualize the data helpful graphs and charts. This provides a quick high level view of the data and helps us understand it faster.
Logging Services
Let's create our services for our logging stack. But one thing we can do before starting the stack is label the logging workers. This will help us tartget those workers so that services are only created on those servers. We can do this by doing the following:
# To list the node that are in the swarm
docker node ls

# Add label to the logger node
docker node update --labe-add logger=true logger-1
Now we can target logger-1 with node.labels.logger == true in our constraints.
Elasticsearch Service
Now let's create our main Elasticsearch service. A caveat to running Elasticsearch is that you need a machine with at least 2GB of RAM and must set the vm.max_map_count to at least 262144. We can do this with the following command:
sudo sysctl --write vm.max_map_count=262144
However, the max_map_count will be reset after a reboot. We can make this persist by creating /etc/sysctl.d/99-sysctl.conf file, if it doesn't exist, on our linux systems.
sudo touch /etc/sysctl.d/99-sysctl.conf
sudo echo "vm.max_map_count=262144" >> /etc/sysctl.d/99-sysctl.conf
Rebooting now should keep that setting in tact. Now we should be able start up our Elasticsearch service without any problems.
# First create our logging network
docker network create --driver overlay log_net

# Now create Elasticsearch service
docker service create \
    --name elasticsearch \
    --network log_net \
    --mount type=volume,source=elasticsearch_index,destination=/usr/share/elasticsearch/data \
    --constraint 'node.labels.logger == true' \
    elasticsearch:alpine
Here we first create our network that will be use by the our logging stack. The three services from our stack will be able to communicate with each other on this network.
Then we create our elasticsearch service using the smaller alpine image that Elasticsearch provides. The two things of note in this service are the volume, and the constraint. The volume we mount so we can presist Elasticsearch index data. And our constraint here uses the label we added to our node earlier. This will allow us to create more logging workers later, and simply add that label to those nodes, now we would easily be able to scale our logging services to those nodes.
Logstash Service
We need to build our own image of Logstash with our custom pipeline, and upload that image to a registery so we can access it on the swarm. Docker has Hub where we can create our account and use that as our registery. So we can start with our logstash.conf file, which will be our pipeline:
input {
    tcp {
        port => 9000
    }
}
filter {
}
output {
    elasticsearch {
        hosts => ["elasticsearch"]
    }
}
We have a simple pipeline that accepts data on a TCP connection on port 9000. Now we can create a Dockerfile for building our custom Logstash image:
FROM logstash:alpine

COPY logstash.conf /logstash_conf/

CMD ["-f", "/logstash_conf/logstash.conf"]
We the alpine image again, copy the logstash.conf to /logstash_conf/, and append the -f /logstash_conf/logstash.conf to the default Logstash image command. This command will now use our pipeline. Now we build the image with the following command:
docker build -t <registry username>/logstash .
We are assuming here that the Dockerfile is in the root of your project directory. That is why we use the . (period) at the end of the command. To push the image to our registry we can use the following commands:
# Login with your Docker Hub account
docker login

# Push image to registry
docker push <registry username>/logstash
And we are finally ready to create our Logstash service:
docker service create \
    --name logstash \
    --network log_net \
    --constraint 'node.labels.logger == true' \
    <registry username>/logstash
There is nothing here that we haven't seen before, other than using our own custom image that we just made.
Kibana Service
We will now create the Kibana service:
docker service create \
    --name kibana \
    --label com.df.notify=true \
    --label com.df.distribute=true \
    --label com.df.port=5601 \
    --label com.df.serviceDomain=logging.customdomain.com \
    --label com.df.servicePath=/ \
    --network main \
    --network log_net \
    --constraint 'node.labels.logger == true' \
    kibana
Here we use the com.df.* labels to notify our frontend services about Kibana. We notify our frontend service, and tell them to distribute, use the port 5601, use the logging.sears.ca domain, and the / path. We use a separate domain here because Kibana requires many URL paths. So using one URL to access Kibana will make it inconienent for our backend services. This service uses both log_net and main networks so it can communicateto the frontend services.
Kibana's will not work unless there is loggin data present in Elasticsearch already. Once we have logging though, we will the beginnings of a great visualization tool.

Here we can recreate our Let's Encrypt service with the above URL added so we get SSL on both URLs:
# Stop the letsencrypt-companion
docker service rm letsencrypt-companion

# Start with added domain
docker service create --name letsencrypt-companion \
    --label com.df.notify=true \
    --label com.df.distribute=true \
    --label com.df.servicePath=/.well-known/acme-challenge \
    --label com.df.port=80 \
    -e DOMAIN_1="('customdomain.com' 'www.customdomain.com')" \
    -e DOMAIN_2="('logging.customdomain.com')" \
    -e DOMAIN_COUNT=2 \
    -e CERTBOT_EMAIL="[email protected]" \
    -e PROXY_ADDRESS="proxy" \
    -e CERTBOT_CRON_RENEW="('0 3 * * *' '0 15 * * *')" \
    --network main \
    --mount type=bind,source=/etc/letsencrypt,destination=/etc/letsencrypt \
    --constraint 'node.id == <id>' \
    --replicas 1 \
    hamburml/docker-flow-letsencrypt:latest
Remember the domain need to be registered and the /etc/letsencrypt directory needs to exist.
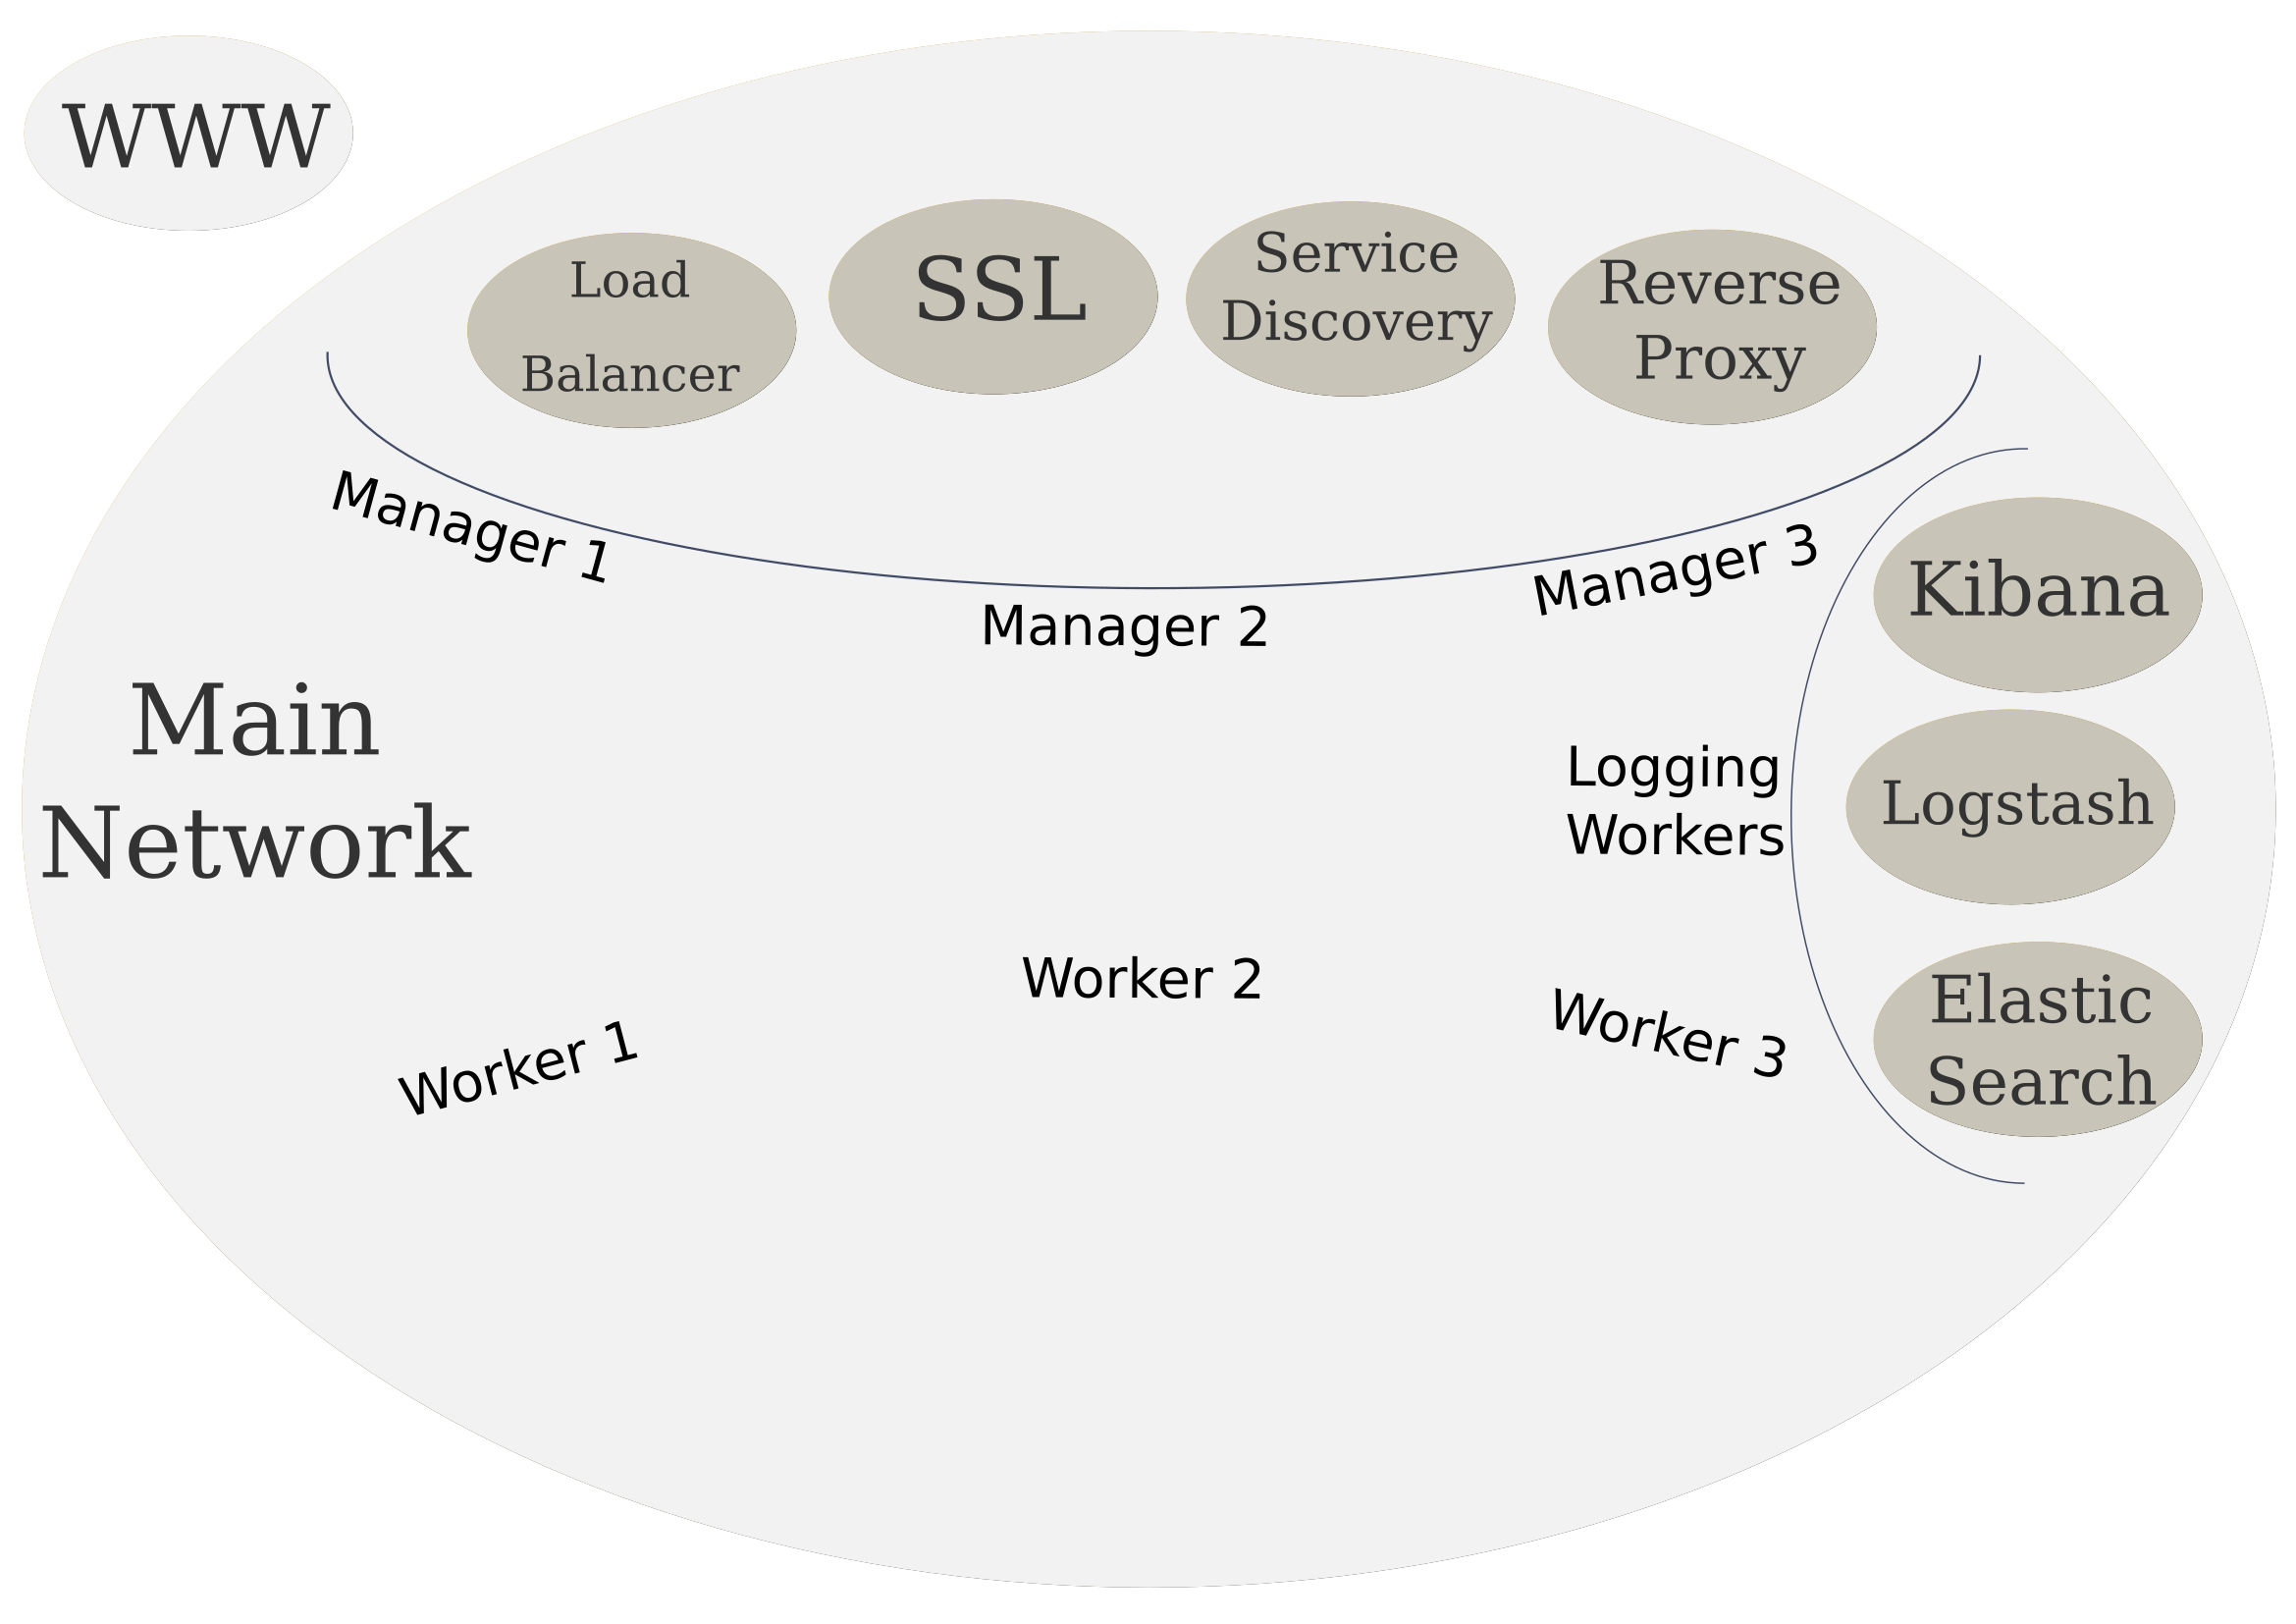
The following is what our cluster looks like now:
Up Next
In the next section we will look how can deploy our custom applications as the backend services to our infrastructure.